.png)
Why LDEx Disability Insurance Data Validation is Critical for Data Scientists
- Dataprepr Team
- Nov 30, 2025
- 5 min read
A deep dive into the complexities of disability insurance data, why validation matters, and how to catch the errors that can cost millions.
Disability insurance data is arguably the most complex data you'll encounter in the insurance analytics space. Unlike life insurance with its binary outcomes, disability data contains intricate interdependencies between coverage types, elimination periods, benefit calculations, and regulatory requirements that can trip up even seasoned data professionals.
The LIMRA Data Exchange (LDEx) standard was created to bring order to this chaos. But having a standard and actually validating data against it are two very different challenges. In this analysis, we'll examine real validation results from an LDEx disability data quality report and explore why each validation rule matters for downstream analytics.

This score looks excellent on the surface. But as we'll see, the devil is in the details. A 92.98% score still means real problems exist in the data, and some of those problems can cascade into significant analytical errors.
The Anatomy of LDEx Disability Data
Before diving into validation, let's understand what we're working with. A typical LDEx disability enrollment file contains three distinct coverage types with very different characteristics:
Short-Term Disability (STD) and Long-Term Disability (LTD) coverages serve different purposes and have different validation requirements. STD typically covers the first 13-26 weeks of disability with shorter elimination periods, while LTD kicks in after STD exhaustion and can continue for years or until retirement age.

The data shows a typical employer-sponsored disability package: one STD policy (100% employer-paid), one basic LTD policy (employer-paid), and one voluntary LTD buy-up option (employee-paid). This structure is common in mid-to-large employers and creates specific validation challenges around coordination between coverages.
Why Data Quality Scoring Matters
The data quality framework breaks validation into four weighted components, each measuring a different dimension of data reliability:

Let's examine what each component measures and why it matters for analytical workflows.
Data Completeness (100% Score, 25% Weight)
Completeness measures whether all expected fields contain values. This dataset achieved 100% completeness across all 67 analyzed fields, a strong foundation but not a guarantee of quality.

Critical fields like MemberID, SSN, DateOfBirth, and AnnualSalary drive downstream calculations. A missing annual salary, for instance, would make it impossible to calculate the weekly benefit amount for a percentage-of-salary disability policy.
Validation Pass Rate (95.45% Score, 40% Weight)
Validation rules check whether values conform to expected formats and business logic. With 40% weight, this is the most influential component of the quality score.

Validation rule results. The failed Disability Benefit Percentage rule indicates a coverage with benefit outside the 40-80% standard range.
13 of 14 validation rules passed. The single failure occurred in the "Disability Benefit % (40-80%)" rule, with one coverage showing a benefit percentage outside the industry-standard range.

"A single failed validation rule on benefit percentage can cascade into incorrect premium calculations, reserve estimates, and claims projections that compound over thousands of policies."
Business Rules Compliance (80% Score, 20% Weight)
Business rules go beyond format validation to check logical relationships and industry practices. This is where the interesting problems surface.

Business rule compliance status. Two WARNING conditions indicate coordination issues that require attention.


Rule BR004 flags a coordination gap: the STD policy has a maximum duration of 182 days (26 weeks), but LTD elimination is only 90 days. This creates a 92-day overlap where an employee could theoretically collect both benefits. Carriers handle this through offsets, but the data doesn't capture that relationship explicitly.
The Anomaly That Reveals Systemic Issues
The anomaly detection found one issue that tells a bigger story about data quality in insurance systems:
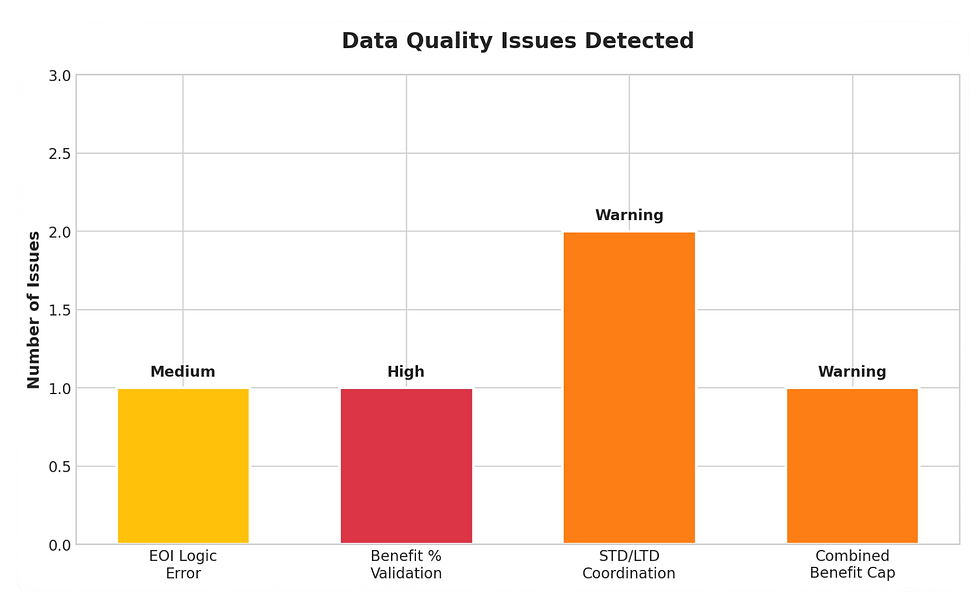
Detected anomalies categorized by severity. The EOI logic error indicates a systemic configuration issue.

This anomaly matters because it reveals a configuration error in the enrollment system. The voluntary LTD buy-up coverage shows EOI_Required = True with a benefit amount of $2,416.67/month, but the Guaranteed Issue limit is $6,000. Since the elected amount is below GI, EOI should not be required.
For a data scientist, this anomaly has several implications:
Data Trust: If the system misconfigures EOI flags, what other business logic might be wrong?
Feature Engineering: EOI status affects enrollment velocity and coverage uptake rates. Incorrect flags would corrupt any model using this feature.
Operational Impact: Employees incorrectly flagged for EOI might abandon enrollment, creating selection bias in the covered population.
What This Means for Data Scientists
LDEx disability data validation isn't just about data hygiene. It directly impacts the quality and reliability of analytical outputs.
Premium Modeling
Disability premiums are calculated as a rate per $100 of covered weekly or monthly earnings. The data shows rates of $0.325 per $100 weekly for STD and $0.60 per $100 monthly for LTD. Any error in salary data or benefit percentage cascades directly into premium calculations.

Claims Reserving
Actuarial reserve models depend on accurate benefit amounts and duration assumptions. The STD/LTD coordination gap identified in BR004 would cause reserves to be miscalculated if models assume clean handoffs between coverage types.
Predictive Analytics
Any machine learning model trained on disability data inherits its quality issues. Features like:
Benefit-to-salary ratios (corrupted by the 140% combined benefit)
EOI flags (unreliable per the anomaly)
Elimination period coordination (gaps not captured)
will introduce systematic bias that degrades model performance in production.
Building a Validation Pipeline
Based on this analysis, here's a practical framework for validating LDEx disability data before analytical use:
Layer 1: Schema Validation
Ensure all expected fields exist with correct data types. This catches gross data corruption and ETL failures.
Layer 2: Format Validation
Apply regex patterns and range checks to individual fields (SSN format, date formats, salary ranges). This is where the 14 validation rules in our report operate.
Layer 3: Relational Validation
Check cross-field relationships: Does total premium equal employer + employee contributions? Does coverage effective date fall after group effective date?
Layer 4: Business Logic Validation
Apply industry knowledge: Do STD and LTD elimination periods coordinate properly? Does combined benefit stay within regulatory limits?
Layer 5: Statistical Anomaly Detection
Flag outliers and unexpected patterns: Benefits below GI requiring EOI, premiums outside expected ranges for the demographic, unusual coverage combinations.

Conclusion
The LDEx disability data quality report we examined scored 92.98% overall, an "A" grade by conventional standards. Yet within that score lurked a benefit calculation that could never be honored (140% combined benefit), a coordination gap between STD and LTD, and an EOI configuration error affecting enrollment workflows.
For data scientists working with disability insurance data, these findings reinforce a critical principle: validation is not optional, and high-level scores can mask significant analytical risks.
The LDEx standard provides structure, but structure without validation is just organized chaos. Build your validation pipelines, document your business rules, and always ask: "What could be wrong with this data that would break my analysis?"
Because in disability insurance, the answer is almost always: quite a lot.
Ready to Validate Your LDEx Data?
Get access to our complete LDEx validation toolkit including R scripts, Python packages, and Excel templates.

Comments